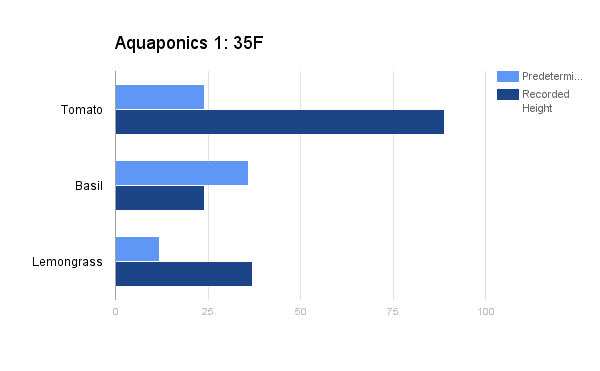
Data will be presented by an analysis of the growth of plants over the period of three months and placed in a bar graph comparing the plant predetermined height to the measured growth
Click to set custom HTML
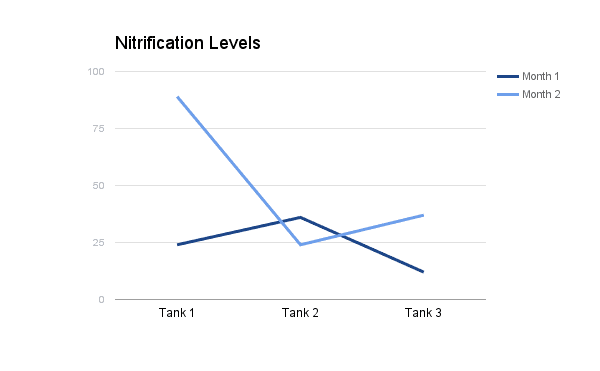
Another analysis of data on the amounts of nitrification will also be charted and compared to other aquaponics tanks in the varied biomes
We will also present our condensed raw data in charts to supplement the graphs.
